
INTRODUCATION
The Elliott Wave Theory is a popular way to analyze financial markets, especially stock prices. It was developed by Ralph Nelson Elliott in the 1930s. The basic idea is that the movement of prices in the market follows a certain pattern that repeats itself over time. These price movements are called “waves.”
Elliott believed that, like natural events (such as ocean waves), stock prices also rise and fall in repetitive cycles. These cycles are driven by the emotions and actions of investors — like optimism, fear, and greed — which influence how people buy and sell stocks.
The Basic Structure of Elliott Waves
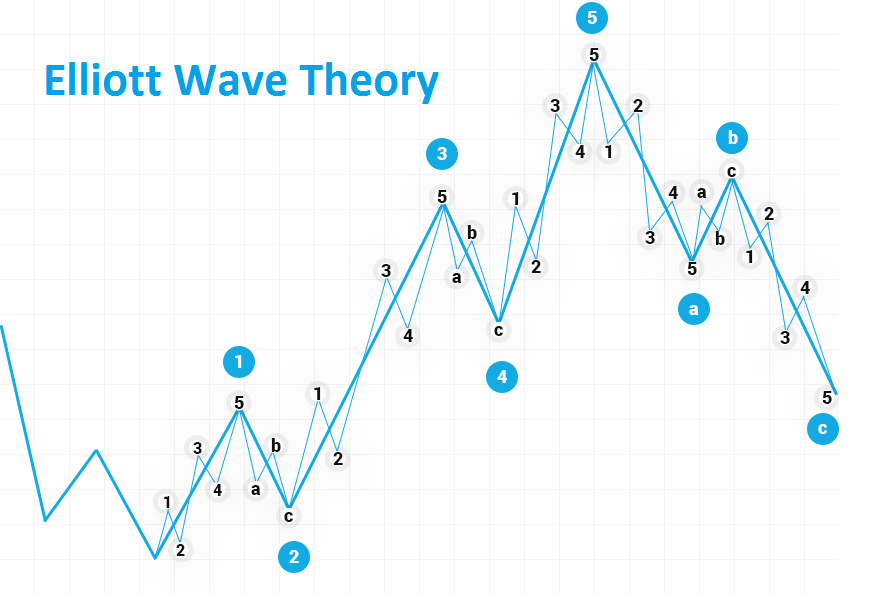
Elliott Wave Theory says that markets move in two main types of waves: Impulse Waves and Corrective Waves.
1. Impulse Waves (Trending Waves)
An impulse wave moves in the direction of the main market trend. This wave consists of five smaller waves, labeled as waves 1, 2, 3, 4, and 5.
- Wave 1: The market starts to rise as a few investors begin to believe prices will go up.
- Wave 2: After Wave 1, prices drop slightly. This happens because some investors sell to take profits.
- Wave 3: This is usually the longest and strongest wave. More investors see the potential and buy, pushing prices higher.
- Wave 4: Prices fall again, but not as much as in Wave 2, as people take profits.
- Wave 5: The final push upward, where prices peak, as most investors are confident the market is strong.
At the end of this impulse wave, the market is often in an overbought condition, meaning too many people have bought the stock, and it’s likely time for a correction.
2. Corrective Waves (Reversing Waves)
After the impulse wave finishes, a corrective wave begins. Corrective waves move against the main trend and consist of three smaller waves, labeled as waves A, B, and C.
- Wave A: The price starts to fall as some investors sell their shares.
- Wave B: Prices rise a little as some traders think the fall was temporary.
- Wave C: The final drop, where prices decrease further, and the market corrects itself.
Once the corrective wave is over, a new impulse wave begins, and the cycle repeats.
Fractals in Elliott Wave Theory
One interesting thing about Elliott Waves is that they are fractal. This means the waves can be found on different time frames — small and large. For example, you can see the same wave patterns on a daily chart, a weekly chart, or even a yearly chart. Each time frame contains its own set of waves within waves.
Rules and Guidelines for Elliott Waves
There are a few key rules when identifying Elliott Waves:
- Wave 2 should never go below the starting point of Wave 1.
- Wave 3 is usually the longest and cannot be the shortest of the five waves.
- Wave 4 should not overlap with the price range of Wave 1.
If any of these rules are broken, it means the pattern is not a valid Elliott Wave.
How Elliott Wave Helps Traders
Many traders use Elliott Wave Theory to predict future price movements. By understanding where the market is within the wave cycle, they can make better decisions about when to buy and sell. For example, traders might buy during Wave 2 or Wave C, when the prices are lower, and sell during Wave 5 or after Wave A, when prices are higher.
However, Elliott Wave Theory is not always easy to apply, and it requires practice to identify the correct waves. Sometimes, different traders might see different wave patterns in the same chart.
Conclusion
Elliott Wave Theory provides a framework for understanding how prices move in the financial markets. It explains that market prices move in predictable patterns due to human emotions and psychology. While it takes time to master, many investors and traders use this theory to guide their decisions.
By learning the basics of impulse waves, corrective waves, and the fractal nature of markets, you can use the Elliott Wave Theory to gain insights into the movements of stock prices and improve your trading strategies.
References:
- Elliott, R.N. (1938). The Wave Principle.
- Frost, A.J., & Prechter, R.R. (2005). Elliott Wave Principle: Key to Market Behavior.
- Gorman, J., & Kennedy, C. (1996). The Visual Guide to Elliott Wave Trading.