Volume: The Silent Indicator

Volume: The Silent Indicator

In the realm of technical analysis, where price movements are scrutinized for patterns and trends, volume stands as a silent yet powerful indicator. While often overlooked, volume provides crucial insights into market sentiment and the strength of price movements. In this article, we explore what volume is, how it works, and how traders can effectively utilize it in their trading strategies.
Understanding Volume

Volume in trading refers to the number of shares or contracts traded in a particular security during a given period. It is typically represented as bars or histograms at the bottom of price charts. Volume reflects the level of activity in the market and is a key measure of liquidity.

How Volume Works

Volume provides traders with valuable information:

  1. Confirmation of Price Movements: High volume during price increases suggests bullish sentiment, while high volume during price declines indicates bearish sentiment. Conversely, low volume during price movements may indicate lack of conviction and potential reversal.
  2. Trend Confirmation: Volume can confirm the strength of a trend. In an uptrend, increasing volume suggests conviction among buyers, while decreasing volume may signal weakening momentum. In a downtrend, the opposite is true.
  3. Reversal Signals: Volume spikes often accompany trend reversals. A sudden increase in volume after a period of consolidation may signal a breakout or breakdown.

Using Volume in Trading

Traders employ various strategies using volume:

  1. Volume Analysis: Traders analyze volume patterns to confirm price movements and identify potential trend reversals. For example, a price breakout accompanied by high volume is considered more reliable than one with low volume.
  2. Volume Moving Averages: Some traders use volume moving averages to smooth out volume fluctuations and identify changes in trend strength.
  3. Volume Divergence: Divergence between price and volume can provide valuable signals. For example, if prices make new highs while volume decreases, it may signal weakness in the uptrend.
  4. Volume Profile: Volume profile analysis identifies significant price levels based on the volume traded at each price level. Traders use this information to identify support and resistance levels and potential breakout or breakdown zones.

Considerations when Using Volume

  • Confirmation: Always confirm volume signals with other technical indicators or price action.
  • Context: Consider the context of volume within the broader market environment, including news events and market sentiment.
  • Market Conditions: Volume may behave differently in different market conditions, such as trending or ranging markets.

Conclusion

Volume is a vital yet often underestimated tool in technical analysis. By understanding its significance and incorporating it into their trading strategies, traders can gain valuable insights into market dynamics and make more informed decisions. Whether used to confirm price movements, identify trend strength, or anticipate reversals, volume provides traders with an additional layer of information to enhance their trading edge. With its ability to reveal market sentiment and the strength of price movements, volume remains an essential component of technical analysis for traders across various financial markets.

Referance: Chatgpt 

Stochastic Oscillator- Technical Indicator

Deciphering the Stochastic Oscillator: A Guide to an Essential Technical Indicator

In the dynamic world of financial markets, traders rely on a plethora of tools to analyze price movements and make informed decisions. Among these tools, the Stochastic Oscillator stands out as a valuable indicator for identifying overbought and oversold conditions and predicting potential trend reversals. In this article, we’ll explore what the Stochastic Oscillator is, how it works, and how traders can utilize it effectively in their trading strategies.

Understanding the Stochastic Oscillator

The Stochastic Oscillator is a momentum indicator that compares a security’s closing price to its price range over a specified period. Developed by George C. Lane in the late 1950s, it measures the speed and change of price movements, helping traders identify overbought and oversold conditions.

Components of the Stochastic Oscillator

The Stochastic Oscillator consists of two lines:

  1. %K Line: This is the main line and represents the current price as a percentage of the high-low range over a specific period, typically 14 periods.

  2. %D Line: The %D line is a moving average of the %K line, typically a three-period simple moving average (SMA) of %K.

The oscillator fluctuates between 0 and 100, with overbought conditions typically considered above 80 and oversold conditions below 20.

How the Stochastic Oscillator Works

The Stochastic Oscillator provides several signals to traders:

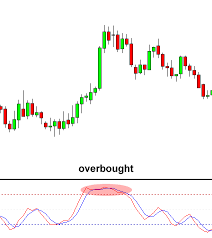
  1. Overbought and Oversold Conditions: When the %K line crosses above 80, it indicates overbought conditions, suggesting that the asset may be due for a downward correction. Conversely, when the %K line crosses below 20, it suggests oversold conditions, signaling a potential upward correction.

  2. Divergence: Divergence occurs when the price of the asset and the Stochastic Oscillator move in opposite directions. Bullish divergence occurs when the price makes a lower low, but the Stochastic Oscillator makes a higher low, indicating potential upward momentum. Conversely, bearish divergence occurs when the price makes a higher high, but the Stochastic Oscillator makes a lower high, suggesting potential downward momentum.

  3. Crosses of %K and %D Lines: When the %K line crosses above the %D line, it generates a bullish signal, indicating upward momentum. Conversely, when the %K line crosses below the %D line, it generates a bearish signal, indicating downward momentum.

Utilizing the Stochastic Oscillator in Trading

Traders employ various strategies using the Stochastic Oscillator:

  • Trend Confirmation: Traders use the oscillator to confirm the strength of a trend. Strong uptrends typically have the oscillator staying above 80, while strong downtrends see it remaining below 20.

  • Overbought/Oversold Signals: Traders look for opportunities to buy when the oscillator indicates oversold conditions and sell when it indicates overbought conditions.

  • Divergence Analysis: Traders analyze divergence between price and the Stochastic Oscillator to anticipate potential reversals or continuations.

Considerations when Using the Stochastic Oscillator

  • Confirmation: Always confirm signals from the Stochastic Oscillator with other indicators or price action.

  • Adjustment of Parameters: Adjust the period lengths of the Stochastic Oscillator to suit different markets and timeframes.

  • Market Conditions: Adapt strategies based on current market conditions, as the Stochastic Oscillator may perform differently in trending and ranging markets.

Conclusion

The Stochastic Oscillator is a versatile tool for traders seeking to identify overbought and oversold conditions and predict potential trend reversals. By understanding its components and signals, traders can incorporate it into their trading strategies to gain valuable insights into market dynamics and make more informed decisions. However, like any indicator, the Stochastic Oscillator is not without limitations and should be used in conjunction with other tools and proper risk management practices. With its ability to provide timely signals and valuable insights, the Stochastic Oscillator remains an essential component of technical analysis for traders across various financial markets.

Referance: CHATGPT

Resize text
Scroll to Top