Mastering Moving Averages: A Guide to the MA Technical Indicator
In the world of financial markets, traders constantly seek tools that can help them navigate the complexities of price movements and make informed decisions. Among the many technical indicators available, the Moving Average (MA) stands as one of the most fundamental and widely used. In this article, we explore what MAs are, how they work, and how traders leverage them to enhance their trading strategies.
Understanding Moving Averages
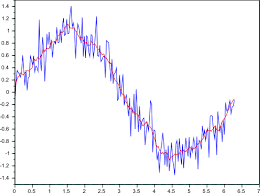
Moving Averages (MAs) are statistical calculations used to analyze data points by creating a series of averages of different subsets of the full data set. In the context of trading, MAs primarily smooth out price data to identify trends over a specified period.
Types of Moving Averages
There are several types of MAs, but the two most common are:
 Simple Moving Average (SMA): SMA calculates the average price of a security over a specific period, equally weighting each data point.
- Exponential Moving Average (EMA): EMA places more weight on recent prices, making it more responsive to recent price changes compared to SMA.
How Moving Averages Work
MAs are plotted as lines on price charts, indicating the average price of a security over a certain period. Traders often use two MAs simultaneously, with different periods, to generate trading signals.
- Golden Cross: When a shorter-term MA crosses above a longer-term MA, it signals a potential uptrend.
- Death Cross: Conversely, when a shorter-term MA crosses below a longer-term MA, it signals a potential downtrend.
Utilizing Moving Averages in Trading
Traders use MAs in various ways to make trading decisions:
- Trend Identification: MAs help identify the direction of the trend. An uptrend is confirmed when prices are above the MA, and a downtrend when prices are below.
- Support and Resistance: MAs act as dynamic support and resistance levels. Prices often bounce off MAs, providing entry or exit points.
- Crossover Signals: Traders use the crossover of MAs to generate buy or sell signals. A bullish crossover occurs when a shorter-term MA crosses above a longer-term MA, and vice versa for a bearish crossover.
- Price Reversal: When prices deviate significantly from the MA, it may signal an overextended market and a potential reversal.
Considerations when using Moving Averages
While MAs offer valuable insights, traders should consider the following:
- Timeframe Selection: Choose MAs based on the trading timeframe. Shorter MAs are suitable for short-term trading, while longer MAs are better for long-term trends.
- Confirmation with Other Indicators: Use MAs in conjunction with other indicators for confirmation of signals.
- Market Conditions: Adapt MAs to different market conditions, as they may perform differently in trending and ranging markets.
Conclusion
Moving Averages serve as a foundational tool for traders across various markets and timeframes. By understanding their types, applications, and potential limitations, traders can incorporate MAs into their trading strategies effectively. Whether used for trend identification, support and resistance, or generating trading signals, mastering Moving Averages can significantly enhance a trader’s ability to interpret price action and make informed decisions in the dynamic world of financial markets.
