

Unveiling Bollianger Bands: A Comprehensive Guide to the Technical Indicator
In the realm of financial markets, traders are constantly on the lookout for effective tools to decipher market movements and make informed decisions. Among the plethora of technical indicators available, Bollinger Bands stand out as a powerful tool for analyzing volatility and identifying potential trend reversals. In this article, we delve into what Bollinger Bands are, how they work, and how traders can utilize them to enhance their trading strategies.
Understanding Bollinger Bands
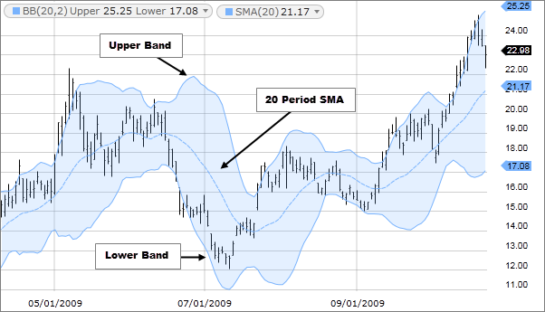
Bollinger Bands were developed by John Bollinger in the 1980s. They consist of three lines:
- Middle Band (MA): The middle band is typically a simple moving average (SMA) of the price data, usually set at 20 periods.
- Upper Band: The upper band is calculated by adding a specified number of standard deviations (usually 2) to the middle band.
- Lower Band: Similarly, the lower band is calculated by subtracting the same number of standard deviations from the middle band.
The distance between the upper and lower bands is a measure of market volatility. When volatility increases, the bands widen, and when it decreases, the bands contract.
How Bollinger Bands Work
Bollinger Bands serve several purposes:
- Volatility Measurement: Widening bands indicate increasing volatility, while narrowing bands suggest decreasing volatility.
- Trend Identification: Prices generally stay within the bands during a trending market. A move above the upper band may signal overbought conditions, while a move below the lower band may signal oversold conditions.
- Reversal Signals: When prices touch or penetrate one of the bands, it may signal a potential reversal. However, it’s essential to use other indicators or price action confirmation to validate signals.\
Using Bollinger Bands in Trading
Traders employ various strategies using Bollinger Bands:
- Bollinger Squeeze: A Bollinger Squeeze occurs when the bands contract tightly, indicating low volatility. Traders anticipate a significant price movement following the squeeze and may enter trades accordingly.
- Bouncing off the Bands: When prices touch the upper or lower band but do not break through, traders may anticipate a reversal back towards the middle band.
- Divergence: When the price forms a higher high but the indicator forms a lower high, or vice versa, it may indicate a potential reversal.
- Trend Confirmation: Traders use Bollinger Bands in conjunction with other indicators to confirm trend direction and identify potential entry or exit points.
Considerations when Using Bollinger Bands
- Confirmation: Always confirm signals from Bollinger Bands with other indicators or price action.
- Adaptation: Adjust the parameters of the bands (such as the number of periods and standard deviations) to suit different markets and timeframes.
- Risk Management: Use appropriate risk management techniques, such as setting stop-loss orders, to protect against adverse price movements.
Conclusion
Bollinger Bands are a valuable tool for traders seeking to analyze volatility, identify potential reversals, and confirm trend direction. By understanding how they work and incorporating them into a comprehensive trading strategy, traders can gain valuable insights into market dynamics and make more informed decisions. However, like any indicator, Bollinger Bands are not foolproof and should be used in conjunction with other tools and proper risk management practices. With their versatility and reliability, Bollinger Bands remain a cornerstone of technical analysis for traders across various financial markets.
 Simple Moving Average (SMA): SMA calculates the average price of a security over a specific period, equally weighting each data point.