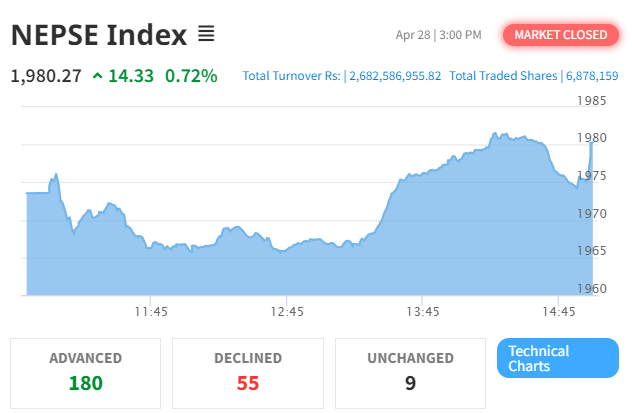
The Nepal Stock Exchange (NEPSE) Index saw a gain of 0.72%, or 14.33 points, settling at 1,980.27 points at the close of trading today, following a loss of 3.24 points in the previous session.
Opening at 1,973.54, the trading day witnessed fluctuations as the index reached an intraday high of 1,981.55 before dipping to an intraday low of 1,965.14.
With a bustling trading environment, 308 different stocks were exchanged in 48,183 transactions. The total volume of shares traded stood at 6,878,159, reflecting a total turnover of Rs. 2.68 Arba. The market capitalization closed at Rs. 31.39 Kharba, with a float market capitalization of Rs. 10.61 Kharba.
Pokhara Finance Ltd. (PFL) emerged as the highlight of the day with a turnover of Rs. 13.05 Crore, closing at a market price of Rs. 665.
Similarly, Pokhara Finance Ltd. (PFL) showed the highest gain of 9.84%, followed by Progressive Finance Limited (PROFL) with a gain of 7.62%.
Conversely, River Falls Power Limited (RFPL) faced a decline, losing 4.63% to close at Rs. 350.00.
In terms of sector, Only one sector Index concluded in positive territory, with the “Finance Index” leading with a gain of 3.98%. However, the “Trading Index” witnessed a decline of 0.34%.
Unlocking Market Volatility: Harnessing the Power of Average True Range
In the world of trading, understanding and managing volatility is crucial for success. Among the myriad of tools available to traders, the Average True Range (ATR) stands out as a key indicator for assessing volatility and setting appropriate trade parameters. In this article, we will explore what the Average True Range is, how it works, and how traders can leverage it effectively in their trading strategies.
Understanding Average True Range (ATR)
Developed by J. Welles Wilder Jr. in the 1970s, the Average True Range (ATR) is a technical indicator that measures market volatility. Unlike other volatility indicators that focus solely on price changes, ATR considers both the price range and gaps between successive periods.
How ATR Works
ATR is calculated by finding the greatest of the following:
The current high minus the current low
The absolute value of the current high minus the previous close
The absolute value of the current low minus the previous close
This calculation results in a value that represents the average trading range over a specified period, typically 14 periods.
Using Average True Range in Trading
Traders utilize ATR in various ways to enhance their trading strategies:
Setting Stop Loss and Take Profit Levels: ATR can help traders set stop-loss orders and take-profit levels based on current market volatility. For example, a trader might set their stop loss at 2 times the ATR below their entry price in a volatile market.
Determining Position Size: ATR can also be used to determine position size, with larger ATR values indicating larger potential price movements and thus requiring smaller position sizes to manage risk.
Volatility Breakouts: Traders can use ATR to identify periods of high volatility and trade breakouts when price breaches previous highs or lows with a significant increase in ATR.
Confirming Trend Strength: Increasing ATR values often accompany strong trends, while decreasing ATR values may signal a weakening trend or consolidation phase.
Considerations when Using Average True Range
Adapting to Market Conditions: ATR values can vary significantly depending on market conditions. Traders should adjust their strategies accordingly.
Combining with Other Indicators: ATR is most effective when used in conjunction with other technical indicators to confirm signals and improve trading accuracy.
Timeframe Selection: Traders should choose the appropriate timeframe for calculating ATR based on their trading style and the duration of the expected price movements.
Conclusion
Average True Range (ATR) is a versatile tool that provides valuable insights into market volatility, helping traders manage risk and make informed trading decisions. By incorporating ATR into their strategies, traders can effectively adjust their position sizes, set appropriate stop-loss and take-profit levels, and identify trading opportunities during periods of high volatility. However, it’s essential to use ATR alongside other indicators and to adapt strategies to changing market conditions for optimal results. With its ability to quantify volatility and guide trading decisions, ATR remains a cornerstone of technical analysis for traders across various financial markets.
Decoding Fibonacci Retracement: Enhancing Trading Strategies with a Time-Tested Tool
In the realm of technical analysis, Fibonacci retracement is a popular tool used by traders to identify potential support and resistance levels within a price trend. Originating from the mathematical sequence discovered by Leonardo Fibonacci in the 13th century, this tool has stood the test of time in financial markets. In this article, we delve into what Fibonacci retracement is, how it works, and how traders can utilize it to bolster their trading strategies.
Understanding Fibonacci Retracement
Fibonacci retracement is based on the idea that markets tend to retrace a portion of a previous move before continuing in the direction of the trend. The key Fibonacci retracement levels are derived from ratios found in the Fibonacci sequence, particularly 23.6%, 38.2%, 50%, 61.8%, and 100%.
How Fibonacci Retracement Works
To apply Fibonacci retracement, traders identify a significant price move (swing high to swing low in a downtrend or swing low to swing high in an uptrend). They then draw Fibonacci retracement levels from the start to the end of that move.
38.2% Level: This level often serves as the first level of support or resistance after a significant price move. It represents a common retracement in trending markets.
50% Level: While not a Fibonacci number, the 50% level is often included in Fibonacci retracement levels. It indicates a moderate retracement and is closely watched by traders.
61.8% Level: This level is known as the “golden ratio” and is considered one of the strongest retracement levels. It often serves as a support or resistance level.
Other Levels: Traders also sometimes use the 23.6% and 78.6% levels, though they are not as commonly emphasized.
Utilizing Fibonacci Retracement in Trading
Traders employ Fibonacci retracement in various ways:
Identifying Support and Resistance: Fibonacci retracement levels act as potential support or resistance zones where traders anticipate price reactions.
Entry and Exit Points: Traders may enter positions near Fibonacci retracement levels with tight stop-loss orders. They may also exit positions or take profit near these levels.
Trend Confirmation: When prices bounce off Fibonacci retracement levels, it confirms the strength of the prevailing trend.
Considerations when Using Fibonacci Retracement
Confirmation: Always confirm Fibonacci retracement levels with other technical indicators, such as trend lines, moving averages, or candlestick patterns.
Market Conditions: Fibonacci retracement may not always work well in choppy or sideways markets. It is most effective in trending markets.
Multiple Timeframes: Use Fibonacci retracement on multiple timeframes to identify significant levels that align with the overall market trend.
Conclusion
Fibonacci retracement is a valuable tool for traders seeking to identify potential support and resistance levels within price trends. By understanding how it works and incorporating it into their trading strategies, traders can gain insights into market dynamics and make more informed decisions. However, like any technical tool, Fibonacci retracement is not foolproof and should be used alongside other indicators and proper risk management techniques. With its ability to identify key price levels and potential reversal points, Fibonacci retracement remains a cornerstone of technical analysis for traders across various financial markets.
Navigating Market Trends with the Ichimoku Cloud: A Comprehensive Guide
In the realm of technical analysis, the Ichimoku Cloud stands as a versatile and comprehensive tool for traders seeking to identify trends, support and resistance levels, and potential reversal points. Developed by Japanese journalist Goichi Hosoda in the late 1930s, the Ichimoku Cloud, also known as Ichimoku Kinko Hyo, offers a holistic view of market dynamics. In this article, we’ll delve into what the Ichimoku Cloud is, how it works, and how traders can effectively utilize it in their trading strategies.
Understanding the Ichimoku Cloud
The Ichimoku Cloud is a technical indicator that provides a visual representation of support and resistance levels, trend direction, and momentum. It consists of several components, each offering valuable insights into market conditions:
Tenkan-sen (Conversion Line): This is calculated as the average of the highest high and the lowest low over the past nine periods. It represents short-term momentum and is often used to gauge trend direction.
Kijun-sen (Base Line): Similar to the Tenkan-sen, the Kijun-sen is calculated as the average of the highest high and lowest low over the past 26 periods. It provides a longer-term view of trend direction and is considered a key support or resistance level.
Senkou Span A (Leading Span A): This is the average of the Tenkan-sen and Kijun-sen, plotted 26 periods ahead. It forms the first boundary of the cloud and acts as a measure of future support or resistance.
Senkou Span B (Leading Span B): This is the average of the highest high and lowest low over the past 52 periods, plotted 26 periods ahead. It forms the second boundary of the cloud and provides another measure of future support or resistance.
Chikou Span (Lagging Span): This is the current closing price plotted 26 periods back. It provides a reference point for assessing the strength of current price movement relative to past prices.
Kumo (Cloud): The area between Senkou Span A and Senkou Span B forms the cloud. The thickness of the cloud represents the volatility of the market, with a thicker cloud indicating stronger support or resistance.
How the Ichimoku Cloud Works
The interaction between the components of the Ichimoku Cloud provides traders with valuable signals:
Price and Cloud Relationship: When the price is above the cloud, it indicates a bullish trend, while a price below the cloud suggests a bearish trend.
Cloud Color Change: A change in the color of the cloud from red to green (or vice versa) can signal a potential change in trend direction.
Kumo Breakouts: When the price breaks out of the cloud, it may signal the beginning of a new trend.
Chikou Span Confirmation: The Chikou Span crossing above or below the price confirms bullish or bearish momentum, respectively.
Using the Ichimoku Cloud in Trading
Traders employ various strategies using the Ichimoku Cloud:
Trend Confirmation: Traders confirm the strength and direction of the trend by analyzing the relationship between the price and the cloud.
Cloud Bounces: Traders may enter trades when the price bounces off the cloud, using it as a support or resistance level.
Kumo Twist: A twist in the cloud (where Senkou Span A crosses above or below Senkou Span B) may signal a change in trend direction.
Chikou Span Confirmation: Traders look for confirmation of bullish or bearish momentum when the Chikou Span crosses above or below the price.
Considerations when Using the Ichimoku Cloud
Confirmation: Always confirm Ichimoku Cloud signals with other technical indicators or price action.
Market Conditions: The Ichimoku Cloud may perform differently in trending and ranging markets. Adapt strategies accordingly.
Timeframe Selection: Consider using the Ichimoku Cloud on multiple timeframes to confirm signals and identify significant levels.
Conclusion
The Ichimoku Cloud is a powerful and versatile tool for traders seeking to analyze trends, identify support and resistance levels, and gauge market momentum. By understanding its components and signals, traders can gain valuable insights into market dynamics and make more informed trading decisions. However, it’s essential to use the Ichimoku Cloud alongside other indicators and to adapt strategies to changing market conditions for optimal results. With its ability to provide a comprehensive view of market trends, the Ichimoku Cloud remains a cornerstone of technical analysis for traders across various financial markets.
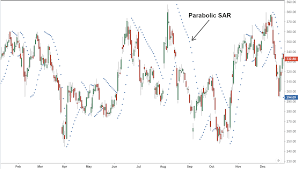
In the ever-evolving landscape of technical analysis, traders rely on a multitude of indicators to make sense of market movements and identify profitable opportunities. Among these tools, the Parabolic SAR (Stop and Reverse) stands out as a versatile and effective indicator for trend following and reversal strategies. In this article, we’ll explore what the Parabolic SAR is, how it works, and how traders can utilize it to enhance their trading strategies.
Understanding Parabolic SAR
Developed by J. Welles Wilder Jr., the Parabolic SAR is a trend-following indicator designed to identify potential reversal points in the price of an asset. It is represented by a series of dots that appear either above or below the price chart, indicating potential stop and reversal points.
How Parabolic SAR Works
The Parabolic SAR is calculated based on the following formula:
𝐴𝐹AF is the acceleration factor, which starts at a value of 0.02 and increases by 0.02 each time the extreme point (EP) reaches a new high or low.
𝐸𝑃𝑛−1EPn−1 is the highest high or lowest low of the previous period.
Using Parabolic SAR in Trading
Traders employ Parabolic SAR in various ways to make trading decisions:
Trend Following: When the Parabolic SAR dots are below the price, it indicates an uptrend, and traders may consider buying. Conversely, when the dots are above the price, it indicates a downtrend, and traders may consider selling short.
Stop Loss Placement: Traders use Parabolic SAR as a trailing stop-loss mechanism. As the price moves in their favor, they adjust their stop-loss orders to follow the SAR dots, locking in profits and minimizing potential losses.
Reversal Signals: When the direction of the SAR dots changes, it may signal a potential trend reversal. Traders look for confirmation from other indicators or price action before entering a trade in the opposite direction.
Considerations when Using Parabolic SAR
Whipsaws: Parabolic SAR can produce whipsaws in ranging markets, where it generates multiple signals but fails to capture sustained trends. Traders should use it in conjunction with other indicators to filter out false signals.
Acceleration Factor: The acceleration factor determines how quickly the SAR moves closer to the price. Traders may adjust the acceleration factor to suit the volatility of the asset being traded.
Confirmation: Always confirm Parabolic SAR signals with other technical indicators or price action to increase the accuracy of trading decisions.
Conclusion
The Parabolic SAR is a valuable tool for traders seeking to ride trends with precision and manage risk effectively. By understanding its mechanics and incorporating it into their trading strategies, traders can gain valuable insights into market trends and identify profitable trading opportunities. However, like any indicator, Parabolic SAR is not without limitations and should be used in conjunction with other tools and proper risk management techniques. With its ability to identify trend direction and potential reversal points, Parabolic SAR remains a cornerstone of technical analysis for traders across various financial markets.
In the realm of technical analysis, where price movements are scrutinized for patterns and trends, volume stands as a silent yet powerful indicator. While often overlooked, volume provides crucial insights into market sentiment and the strength of price movements. In this article, we explore what volume is, how it works, and how traders can effectively utilize it in their trading strategies.
Understanding Volume
Volume in trading refers to the number of shares or contracts traded in a particular security during a given period. It is typically represented as bars or histograms at the bottom of price charts. Volume reflects the level of activity in the market and is a key measure of liquidity.
Volume provides traders with valuable information:
Confirmation of Price Movements: High volume during price increases suggests bullish sentiment, while high volume during price declines indicates bearish sentiment. Conversely, low volume during price movements may indicate lack of conviction and potential reversal.
Trend Confirmation: Volume can confirm the strength of a trend. In an uptrend, increasing volume suggests conviction among buyers, while decreasing volume may signal weakening momentum. In a downtrend, the opposite is true.
Reversal Signals: Volume spikes often accompany trend reversals. A sudden increase in volume after a period of consolidation may signal a breakout or breakdown.
Using Volume in Trading
Traders employ various strategies using volume:
Volume Analysis: Traders analyze volume patterns to confirm price movements and identify potential trend reversals. For example, a price breakout accompanied by high volume is considered more reliable than one with low volume.
Volume Moving Averages: Some traders use volume moving averages to smooth out volume fluctuations and identify changes in trend strength.
Volume Divergence: Divergence between price and volume can provide valuable signals. For example, if prices make new highs while volume decreases, it may signal weakness in the uptrend.
Volume Profile: Volume profile analysis identifies significant price levels based on the volume traded at each price level. Traders use this information to identify support and resistance levels and potential breakout or breakdown zones.
Considerations when Using Volume
Confirmation: Always confirm volume signals with other technical indicators or price action.
Context: Consider the context of volume within the broader market environment, including news events and market sentiment.
Market Conditions: Volume may behave differently in different market conditions, such as trending or ranging markets.
Conclusion
Volume is a vital yet often underestimated tool in technical analysis. By understanding its significance and incorporating it into their trading strategies, traders can gain valuable insights into market dynamics and make more informed decisions. Whether used to confirm price movements, identify trend strength, or anticipate reversals, volume provides traders with an additional layer of information to enhance their trading edge. With its ability to reveal market sentiment and the strength of price movements, volume remains an essential component of technical analysis for traders across various financial markets.
Deciphering the Stochastic Oscillator: A Guide to an Essential Technical Indicator
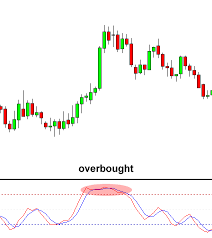
In the dynamic world of financial markets, traders rely on a plethora of tools to analyze price movements and make informed decisions. Among these tools, the Stochastic Oscillator stands out as a valuable indicator for identifying overbought and oversold conditions and predicting potential trend reversals. In this article, we’ll explore what the Stochastic Oscillator is, how it works, and how traders can utilize it effectively in their trading strategies.
The Stochastic Oscillator is a momentum indicator that compares a security’s closing price to its price range over a specified period. Developed by George C. Lane in the late 1950s, it measures the speed and change of price movements, helping traders identify overbought and oversold conditions.
Components of the Stochastic Oscillator
The Stochastic Oscillator consists of two lines:
%K Line: This is the main line and represents the current price as a percentage of the high-low range over a specific period, typically 14 periods.
%D Line: The %D line is a moving average of the %K line, typically a three-period simple moving average (SMA) of %K.
The oscillator fluctuates between 0 and 100, with overbought conditions typically considered above 80 and oversold conditions below 20.
How the Stochastic Oscillator Works
The Stochastic Oscillator provides several signals to traders:
Overbought and Oversold Conditions: When the %K line crosses above 80, it indicates overbought conditions, suggesting that the asset may be due for a downward correction. Conversely, when the %K line crosses below 20, it suggests oversold conditions, signaling a potential upward correction.
Divergence: Divergence occurs when the price of the asset and the Stochastic Oscillator move in opposite directions. Bullish divergence occurs when the price makes a lower low, but the Stochastic Oscillator makes a higher low, indicating potential upward momentum. Conversely, bearish divergence occurs when the price makes a higher high, but the Stochastic Oscillator makes a lower high, suggesting potential downward momentum.
Crosses of %K and %D Lines: When the %K line crosses above the %D line, it generates a bullish signal, indicating upward momentum. Conversely, when the %K line crosses below the %D line, it generates a bearish signal, indicating downward momentum.
Utilizing the Stochastic Oscillator in Trading
Traders employ various strategies using the Stochastic Oscillator:
Trend Confirmation: Traders use the oscillator to confirm the strength of a trend. Strong uptrends typically have the oscillator staying above 80, while strong downtrends see it remaining below 20.
Overbought/Oversold Signals: Traders look for opportunities to buy when the oscillator indicates oversold conditions and sell when it indicates overbought conditions.
Divergence Analysis: Traders analyze divergence between price and the Stochastic Oscillator to anticipate potential reversals or continuations.
Considerations when Using the Stochastic Oscillator
Confirmation: Always confirm signals from the Stochastic Oscillator with other indicators or price action.
Adjustment of Parameters: Adjust the period lengths of the Stochastic Oscillator to suit different markets and timeframes.
Market Conditions: Adapt strategies based on current market conditions, as the Stochastic Oscillator may perform differently in trending and ranging markets.
Conclusion
The Stochastic Oscillator is a versatile tool for traders seeking to identify overbought and oversold conditions and predict potential trend reversals. By understanding its components and signals, traders can incorporate it into their trading strategies to gain valuable insights into market dynamics and make more informed decisions. However, like any indicator, the Stochastic Oscillator is not without limitations and should be used in conjunction with other tools and proper risk management practices. With its ability to provide timely signals and valuable insights, the Stochastic Oscillator remains an essential component of technical analysis for traders across various financial markets.
In the dynamic world of financial markets, traders constantly seek tools that can help them make informed decisions amidst volatility. Among the plethora of strategies and methodologies, technical analysis stands out as a popular approach. Technical indicators, in particular, play a crucial role in helping traders identify trends, gauge market sentiment, and time their trades effectively. Here, we delve into the ten best technical indicators that traders rely on for success.
1. Moving Averages (MA): Moving averages smooth out price data to identify trends over a specified period. The most common types are Simple Moving Average (SMA) and Exponential Moving Average (EMA). MAs help traders identify trend direction and potential reversal points.
2. Relative Strength Index (RSI): RSI measures the speed and change of price movements, indicating overbought or oversold conditions. Traders use RSI to confirm trends and identify potential trend reversals.
3. Moving Average Convergence Divergence(MACD):MACD combines two MAs to signal changes in momentum. It consists of the MACD line, signal line, and histogram, providing insights into trend strength and potential crossovers.
4. Bollinger Bands:Bollinger Bands consist of a moving average and two standard deviations plotted above and below it. They help traders identify volatility and potential price reversals when the bands contract or expand.
5. Stochastic Oscillator: The Stochastic Oscillator compares a security’s closing price to its price range over a specified period. It helps traders identify overbought or oversold conditions and potential trend reversals.
6. Fibonacci Retracement: Based on the Fibonacci sequence, this tool identifies potential support and resistance levels. Traders use Fibonacci retracement levels to anticipate price corrections within a trend.
7. Average True Range (ATR): ATR measures market volatility by analyzing price ranges over a specified period. Traders use ATR to set stop-loss levels and determine position size according to market conditions.
8. Ichimoku Cloud: This complex indicator provides insights into trend direction, momentum, and support/resistance levels. It consists of five lines, with the cloud (Kumo) representing future support and resistance zones.
9Volume reflects the number of shares or contracts traded in a security. Traders use volume to confirm price trends and identify potential reversals. High volume often accompanies strong price moves.
10. Parabolic SAR (Stop and Reverse): Parabolic SAR helps traders identify potential trend reversals. It places dots above or below the price, signaling when the trend direction may change.
While these indicators offer valuable insights, it’s essential to understand that no single indicator guarantees success. Traders often combine multiple indicators to confirm signals and increase their probability of making profitable trades. Moreover, they should adapt their strategies to changing market conditions and employ risk management techniques to protect their capital.
In conclusion, mastering these ten technical indicators can significantly enhance a trader’s ability to analyze markets and make informed decisions. Whether you’re a novice or seasoned trader, integrating these tools into your trading arsenal can be the key to unlocking success in the financial markets.
Unveiling Bollianger Bands: A Comprehensive Guide to the Technical Indicator
In the realm of financial markets, traders are constantly on the lookout for effective tools to decipher market movements and make informed decisions. Among the plethora of technical indicators available, Bollinger Bands stand out as a powerful tool for analyzing volatility and identifying potential trend reversals. In this article, we delve into what Bollinger Bands are, how they work, and how traders can utilize them to enhance their trading strategies.
Understanding Bollinger Bands
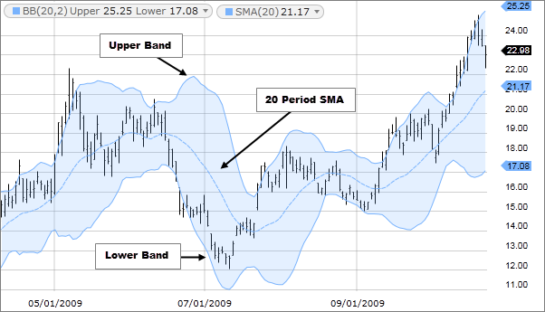
Bollinger Bands were developed by John Bollinger in the 1980s. They consist of three lines:
Middle Band (MA): The middle band is typically a simple moving average (SMA) of the price data, usually set at 20 periods.
Upper Band: The upper band is calculated by adding a specified number of standard deviations (usually 2) to the middle band.
Lower Band: Similarly, the lower band is calculated by subtracting the same number of standard deviations from the middle band.
The distance between the upper and lower bands is a measure of market volatility. When volatility increases, the bands widen, and when it decreases, the bands contract.
Trend Identification: Prices generally stay within the bands during a trending market. A move above the upper band may signal overbought conditions, while a move below the lower band may signal oversold conditions.
Reversal Signals: When prices touch or penetrate one of the bands, it may signal a potential reversal. However, it’s essential to use other indicators or price action confirmation to validate signals.\
Using Bollinger Bands in Trading
Traders employ various strategies using Bollinger Bands:
Bollinger Squeeze: A Bollinger Squeeze occurs when the bands contract tightly, indicating low volatility. Traders anticipate a significant price movement following the squeeze and may enter trades accordingly.
Bouncing off the Bands: When prices touch the upper or lower band but do not break through, traders may anticipate a reversal back towards the middle band.
Divergence: When the price forms a higher high but the indicator forms a lower high, or vice versa, it may indicate a potential reversal.
Trend Confirmation: Traders use Bollinger Bands in conjunction with other indicators to confirm trend direction and identify potential entry or exit points.
Considerations when Using Bollinger Bands
Confirmation: Always confirm signals from Bollinger Bands with other indicators or price action.
Adaptation: Adjust the parameters of the bands (such as the number of periods and standard deviations) to suit different markets and timeframes.
Risk Management: Use appropriate risk management techniques, such as setting stop-loss orders, to protect against adverse price movements.
Conclusion
Bollinger Bands are a valuable tool for traders seeking to analyze volatility, identify potential reversals, and confirm trend direction. By understanding how they work and incorporating them into a comprehensive trading strategy, traders can gain valuable insights into market dynamics and make more informed decisions. However, like any indicator, Bollinger Bands are not foolproof and should be used in conjunction with other tools and proper risk management practices. With their versatility and reliability, Bollinger Bands remain a cornerstone of technical analysis for traders across various financial markets.
Mastering Moving Averages: A Guide to the MA Technical Indicator
In the world of financial markets, traders constantly seek tools that can help them navigate the complexities of price movements and make informed decisions. Among the many technical indicators available, the Moving Average (MA) stands as one of the most fundamental and widely used. In this article, we explore what MAs are, how they work, and how traders leverage them to enhance their trading strategies.
Understanding Moving Averages
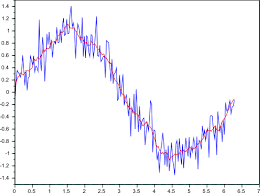
Moving Averages (MAs) are statistical calculations used to analyze data points by creating a series of averages of different subsets of the full data set. In the context of trading, MAs primarily smooth out price data to identify trends over a specified period.
Types of Moving Averages
There are several types of MAs, but the two most common are:
Simple Moving Average (SMA): SMA calculates the average price of a security over a specific period, equally weighting each data point.
Exponential Moving Average (EMA): EMA places more weight on recent prices, making it more responsive to recent price changes compared to SMA.
How Moving Averages Work
MAs are plotted as lines on price charts, indicating the average price of a security over a certain period. Traders often use two MAs simultaneously, with different periods, to generate trading signals.
Golden Cross: When a shorter-term MA crosses above a longer-term MA, it signals a potential uptrend.
Death Cross: Conversely, when a shorter-term MA crosses below a longer-term MA, it signals a potential downtrend.
Utilizing Moving Averages in Trading
Traders use MAs in various ways to make trading decisions:
Trend Identification:MAs help identify the direction of the trend. An uptrend is confirmed when prices are above the MA, and a downtrend when prices are below.
Support and Resistance: MAs act as dynamic support and resistance levels. Prices often bounce off MAs, providing entry or exit points.
Crossover Signals: Traders use the crossover of MAs to generate buy or sell signals. A bullish crossover occurs when a shorter-term MA crosses above a longer-term MA, and vice versa for a bearish crossover.
Price Reversal: When prices deviate significantly from the MA, it may signal an overextended market and a potential reversal.
Considerations when using Moving Averages
While MAs offer valuable insights, traders should consider the following:
Timeframe Selection: Choose MAs based on the trading timeframe. Shorter MAs are suitable for short-term trading, while longer MAs are better for long-term trends.
Confirmation with Other Indicators: Use MAs in conjunction with other indicators for confirmation of signals.
Market Conditions: Adapt MAs to different market conditions, as they may perform differently in trending and ranging markets.
Conclusion
Moving Averages serve as a foundational tool for traders across various markets and timeframes. By understanding their types, applications, and potential limitations, traders can incorporate MAs into their trading strategies effectively. Whether used for trend identification, support and resistance, or generating trading signals, mastering Moving Averages can significantly enhance a trader’s ability to interpret price action and make informed decisions in the dynamic world of financial markets.
Unlocking the Power of MACD: A Comprehensive Guide to the Moving Average Convergence Divergence Indicator
In the fast-paced world of financial markets, traders rely on sophisticated tools to interpret price movements and optimize their trading strategies. Among these tools, the Moving Average Convergence Divergence (MACD) stands out as a versatile and powerful technical indicator. This article aims to demystify MACD, explaining its components, how it works, and how traders utilize it effectively.
The Moving Average Convergence Divergence (MACD) is a momentum indicator that illustrates the relationship between two exponential moving averages (EMAs) of a security’s price. Comprised of three main components – the MACD line, Signal line, and Histogram – it provides valuable insights into market momentum and potential trend reversals.
MACD Line: Calculated by subtracting the 26-day EMA from the 12-day EMA, the MACD line represents short-term momentum.
Signal Line: This is a 9-day EMA of the MACD line, acting as a trigger for buy and sell signals.
Histogram: The Histogram visually depicts the difference between the MACD line and the Signal line, highlighting the convergence and divergence of the two.
MACD oscillates above and below a centerline, indicating bullish or bearish momentum. Traders typically look for three types of signals:
Crossover Signals: When the MACD line crosses above the Signal line, it suggests a bullish trend, while a cross below indicates a bearish trend.
Divergence Signals: Bullish divergence occurs when the price makes a lower low but the MACD makes a higher low, signaling potential upward momentum. Conversely, bearish divergence suggests potential downward momentum.
Histogram Analysis: Contraction or expansion of the histogram indicates changes in momentum, aiding traders in identifying potential trend reversals or continuations.
Traders employ MACD in various ways to make informed decisions:
Trend Confirmation:MACD confirms trend direction, with a rising MACD indicating bullish momentum and a falling MACD suggesting bearish momentum.
Entry and Exit Signals: Crossovers between the MACD and Signal lines provide entry and exit points. Buying occurs when the MACD crosses above the Signal line, while selling occurs when it crosses below.
Divergence Analysis: Traders analyze divergence between price and MACD to anticipate trend reversals or continuations.
Histogram Trends: Monitoring histogram movements helps traders gauge changes in momentum and potential shifts in market sentiment.
Conclusion
The MACD is a valuable tool for traders seeking to understand market momentum and identify potential trading opportunities. By mastering its components and signals, traders can enhance their strategies and make more informed decisions. However, it’s crucial to use MACD alongside other indicators and consider market conditions and risk management principles. With its ability to capture both short-term and long-term trends, MACD remains a cornerstone of technical analysis for traders across diverse financial markets.
Resize text
Manage Consent
To provide the best experiences, we use technologies like cookies to store and/or access device information. Consenting to these technologies will allow us to process data such as browsing behavior or unique IDs on this site. Not consenting or withdrawing consent, may adversely affect certain features and functions.
Functional
Always active
The technical storage or access is strictly necessary for the legitimate purpose of enabling the use of a specific service explicitly requested by the subscriber or user, or for the sole purpose of carrying out the transmission of a communication over an electronic communications network.
Preferences
The technical storage or access is necessary for the legitimate purpose of storing preferences that are not requested by the subscriber or user.
Statistics
The technical storage or access that is used exclusively for statistical purposes.The technical storage or access that is used exclusively for anonymous statistical purposes. Without a subpoena, voluntary compliance on the part of your Internet Service Provider, or additional records from a third party, information stored or retrieved for this purpose alone cannot usually be used to identify you.
Marketing
The technical storage or access is required to create user profiles to send advertising, or to track the user on a website or across several websites for similar marketing purposes.


 In the dynamic world of financial markets, traders constantly seek tools that can help them make informed decisions amidst volatility. Among the plethora of strategies and methodologies, technical analysis stands out as a popular approach. Technical indicators, in particular, play a crucial role in helping traders identify trends, gauge market sentiment, and time their trades effectively. Here, we delve into the ten best technical indicators that traders rely on for success.
 Simple Moving Average (SMA): SMA calculates the average price of a security over a specific period, equally weighting each data point.